
Market Bubble Metrics at 0.91 vs. The Media's Great Disconnect

Rising real interest rates are crashing into the largest debt-fueled spending cycle in corporate history. Here is your Q3 capital playbook.
Sovereigns,
I hope you all had an excellent long weekend marking the historic 250th Independence Day of the United States. While the public pageantry was in full swing, our primary mandate remains entirely unchanged: look past the celebratory theater, filter out the noise, and audit the structural mechanics of global capital before the opening bell.
The new quarter opens with a fierce clash. Most media outlets will spend ninety days trying to explain it. They will fail.
The U.S. economy is adding jobs, consumers keep spending, and sentiment is ticking up. By every normal measure, the underlying economic engine is running. Yet the S&P 500 and Nasdaq fell in June. The Magnificent Seven—the stocks that drove roughly 40% of S&P 500 gains in 2025—are down for the year. Semiconductor bubble risk, per Bank of America's scale, has hit an extreme 0.91 out of 1.0.
The Buffett Indicator closed Q1 at a staggering 218%, sitting just one point below its all-time historical peak. Concurrently, the S&P 500 price-to-sales ratio sits at 3.22, compared to its long-term average of 1.84.
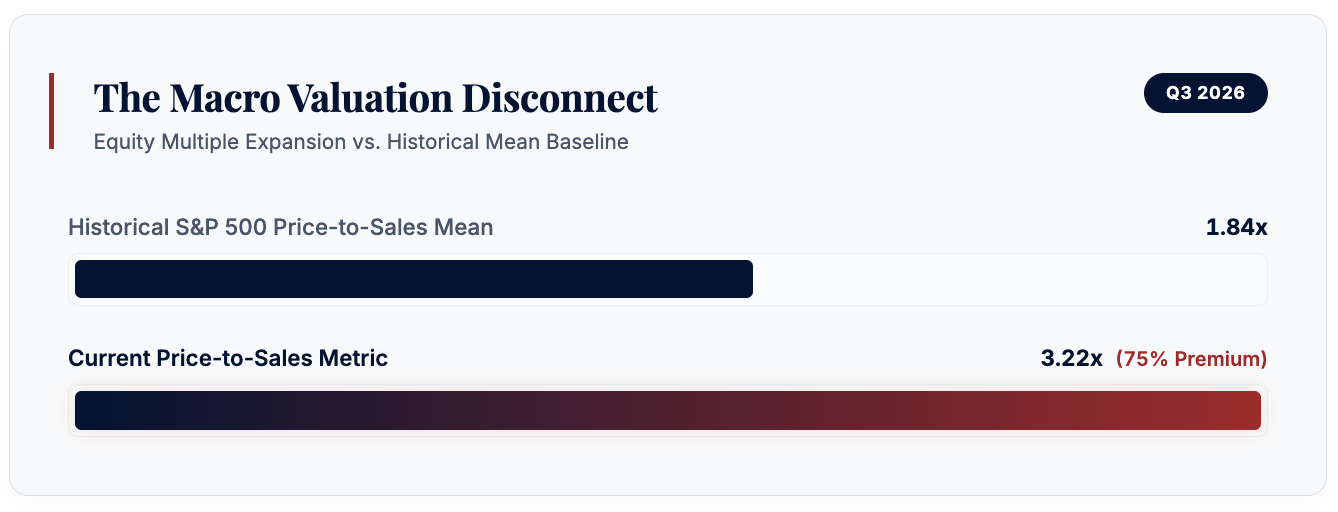
This is not a mixed signal. It is a fundamental split—and it is the single biggest factor shaping your capital plan for the rest of 2026. The media calls it "confusing." At the capital layer, it is simple: rising real rates are crashing into the largest debt-funded spending cycle in corporate history. The AI buildout has pushed hyperscalers—firms once known for pristine, cash-rich balance sheets—into the bond market. Total corporate debt issuance across this cluster may reach $250 billion this year alone.
Today, we will look past the noise and break down three critical layers: the macro split, the hyperscaler debt load, and a specific cash-flow opening in the streaming sector roll-up.
Real Rates, Bubble Metrics, and the Repricing Engine
Fed Chair Kevin Warsh struck a hawkish tone at his first policy meeting, injecting a factor most equity models completely missed: rates may move higher, not lower.
Whether the Fed executes another formal hike is beside the point. What matters is the quiet shift in real interest rates—nominal rates minus inflation. When real interest rates rise, the discount rate applied to future cash flows increases. That single structural adjustment shrinks the present value of every growth stock on the board.
The damage is already showing across the core data arrays:
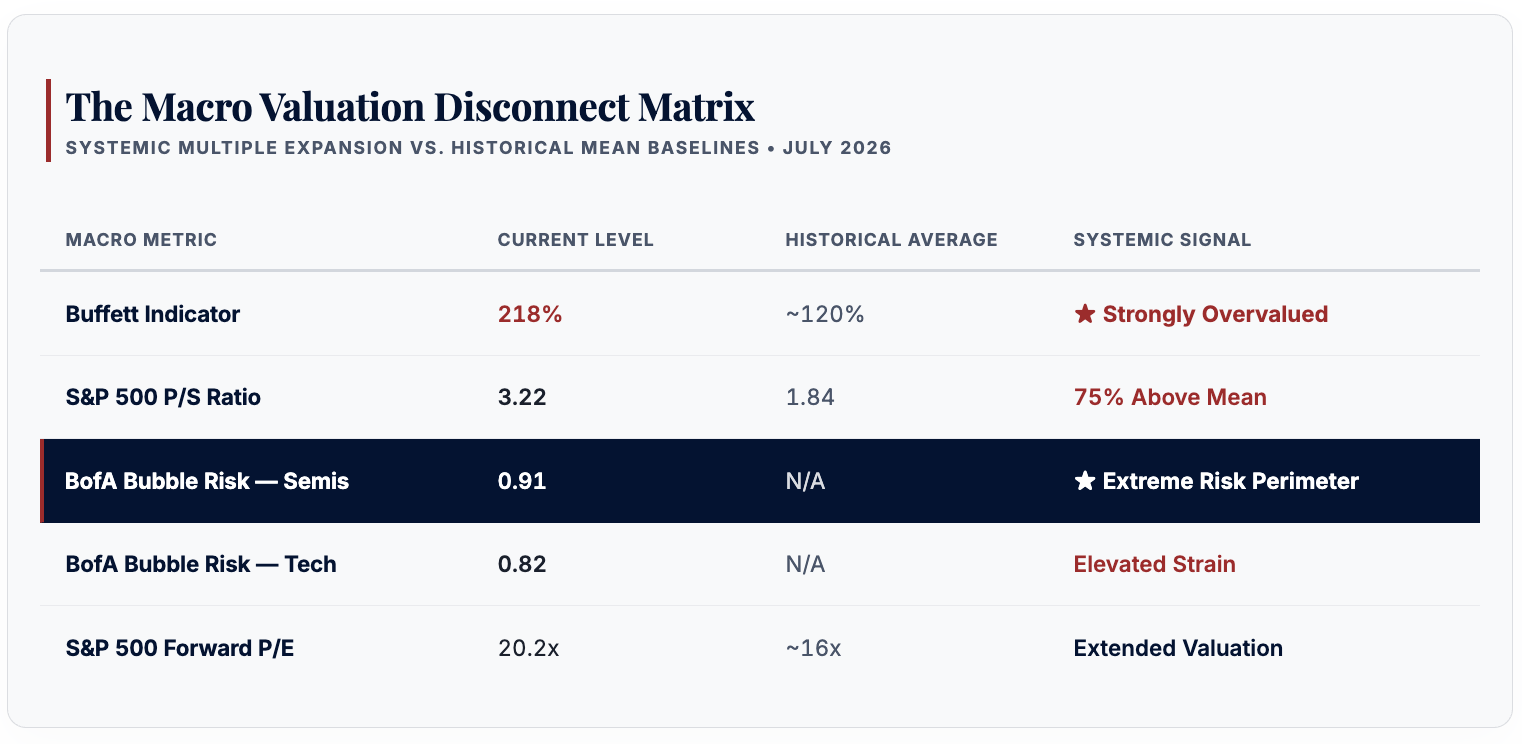
Gold, Bitcoin, Microsoft, and Meta have all pulled back from their recent highs. Goldman Sachs recently noted that while lower oil prices help the broader cycle, that good news is already baked into stretched asset prices. Goldman analyst Kamakshya Trivedi stated plainly that the AI trade has become "the primary source of volatility in equity markets."
When one concentrated trade drives the bulk of index swings, diversification is no longer a theory—it is a live portfolio threat. For Individual Sovereigns with finite capital, this demands a focused, sector-level response.
The Corporate Weaponization: Hyperscaler Debt and Balance Sheet Decay
I spent years inside large firms where the term "strategic investment" was used to mask balance sheet decay. In a rigorous private equity review, it would have triggered instant corrective action. The hyperscaler debt cycle now in motion carries the exact same pattern—at a far larger scale.
The numbers are clear: Amazon and Alphabet have offloaded roughly $60 billion in corporate bonds over the past twelve months. Total bond sales by major hyperscalers have already passed the full-year 2025 total. BNP Paribas projects that this total issuance will reach $250 billion for 2026. These mega-caps were once defined by fortress balance sheets. That era is ending. This structural shift is permanent.
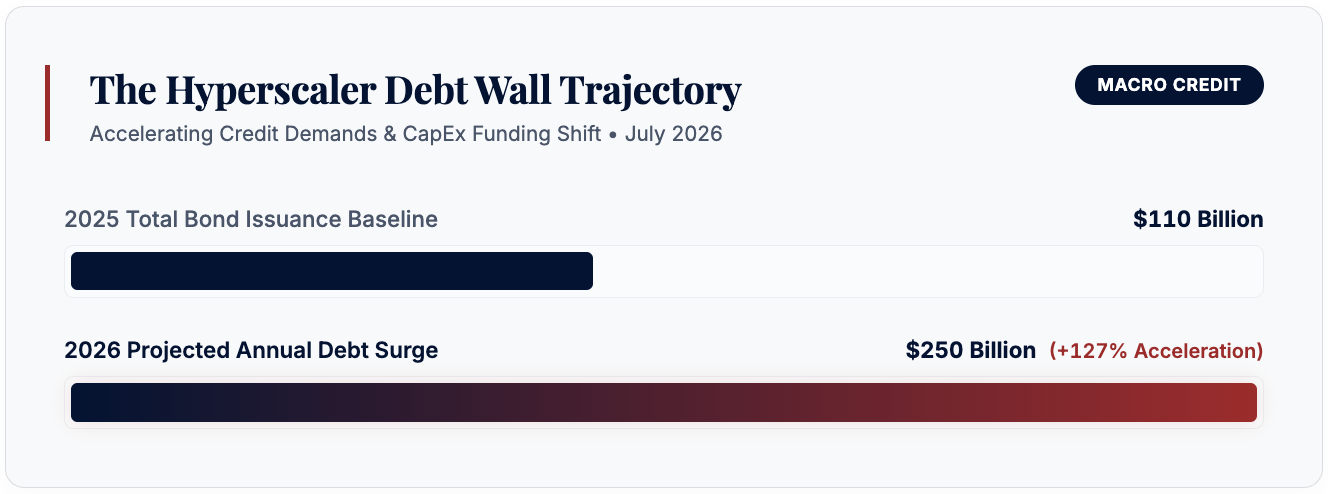
The key question remains: does AI spending produce intermediate returns that justify this added leverage? UBS has already started to answer, cutting exposure to chip and hardware stocks in their AI book while warning that hyperscalers may trim future infrastructure spending as share prices drop.
We are watching a classic late-cycle pattern: the tool sellers (chip makers) grab the immediate margins, while the miners (hyperscalers writing the checks) absorb the long-term balance sheet risk. The drag from servicing $250 billion in new debt will weigh on free cash flow for years.
The Tactical Strike: Netflix, Streaming Roll-Up, and the Margin Shift
While hyperscaler debt adds risk at the index level, the streaming sector is undergoing a massive corporate roll-up that builds an entirely different structure—one moving toward oligopoly-grade margin safety.
The proof is now in the filings, not the rumors. Paramount bought Warner Bros. Discovery for $110.9 billion, topping Netflix's $82.7 billion bid. Disney took full control of Hulu, and Comcast is spinning off NBCUniversal and Sky as a standalone unit. The field is rapidly shrinking to a Big Three—Netflix, Amazon Prime Video, and the Disney/Hulu bundle—with Paramount-WBD as a supplemental fourth. Fewer rivals means immense pricing power and wider margins for the remaining winners.
Netflix's capital profile deserves a close look:
- 2025 Realized Revenue: $45.2 billion (+16% YoY)
- 2026 Structural Revenue Guide: $50.7–$51.7 billion
- Operating Margin Expansion: 29.5% in 2025, up from 21% in 2023
- Free Cash Flow Generation: ~$9.5 billion with a 25.4% FCF Margin (TTM)
- Global Core Subscriber Base: 325 million users
The stock currently trades near $74, while the median analyst target sits at $780. Even if you apply a heavy discount to Wall Street's forward estimates, the gap between cash-flow output and current market pricing is stark.
The ad-supported subscription tier is acting as a second engine, driving over 60% of new sign-ups in ad markets in Q1. Furthermore, the Omnicom AI-powered ad deal from late June uses first-party viewer data for targeted ads—a layer that MoffettNathanson models at $9.6 billion by 2030. The content arms race that burned billions in capital across streaming for a decade is over. Fewer bidders means lower content costs, flowing straight to the net margin line.
Tesla. SpaceX. Starlink. The pattern that makes early investors rich. (Ad)
|
The Sovereign Directive: Q3 2026 Positioning Framework
The market will keep buying every dip until it structurally cannot. Individual Sovereigns do not rely on that pattern; we place capital where the underlying data supports the thesis.
Three structural actions to take now:
- Audit Your Magnificent Seven Exposure: If these concentrated names make up more than 15% of your total portfolio, the concentration risk completely outweighs the growth narrative. The $250 billion debt cycle has changed the risk profile of these holdings.
- Execute Option Roll Rules Mechanically: On your current options positions, if an equity is under downward pressure, run the roll test immediately. If rolling the contract yields a net credit with at least a 0.10 delta gain, execute. If not, prepare for assignment or close and redeploy. Do not hold through expiry on hope.
- Re-Index Toward Consolidated Cash Flow: Streaming roll-up assets—specifically Netflix—merit review as defensive capital targets. An enterprise producing $9.5 billion in annual free cash flow with a 25.4% FCF margin, scaling an advertising layer, and operating in a shrinking competitive field is positioned to harvest returns from broad market sell-offs.
Read more in my latest post to secure the exact strike parameters and debt-schedule watchlists required to navigate this Q3 transition.
The fireworks end; the debt does not. Protect your capital and deploy with precision.
Position your perimeter accordingly.
— Patrick Gibson The Reclaimed Capitalist
250th birthday flash sale
Until Monday, I'm opening the doors to my Power Gauge Report in a flash sale for America's 250th birthday.
I'm also offering a FREE year of access to my Power Gauge rating system, so you can look up any stock you want and see if it's rated Bullish or Bearish.
I've helped build three indexes for the Nasdaq during my 60 years on Wall Street, and you can find the tools I developed on every professional Bloomberg and Reuters terminal in the world.
My tools have helped billionaire investors grow their assets by as much as 69,000%.
And today, through this limited-time 4th of July sale, you can get my flagship rating system at no cost for a full year – as part of your Power Gauge Report membership.
Start here with an inside look at my powerful investing strategy that boils down to " Sell This, Buy That."
It's a way to rid yourself of overpriced AI stocks before the tech trade breaks down this summer...
And instead move that money into smaller, lesser-known names that are showing real potential to dethrone the Magnificent Seven.
I even give away a Hotlist and Hitlist of buy and sell ideas that you can act on right now.
Like my recommendation I call " an upgrade to Tesla stock." It's a little-known company that just inked a groundbreaking partnership with the king of AI, Nvidia. This deal virtually hands this under-the-radar firm the keys to the self-driving industry's biggest customers, putting them miles ahead of Tesla in the autonomous vehicle race.
That's why I want to put this stock on your radar before markets open.
Get the name and ticker symbol – plus my first-ever 4th of July discount – when you click here before it expires on July 6th.
(ad)
You can also like:
- Trump’s new tech bill could put quadrillions (ad)
- Annual Economic Report 2026 (BIS)
- The $15 Gold Fund That Pays Up to $1,152/Month (from Investors Alley)
- Ford rehires ‘gray beard’ engineers after AI falls short (TechCrunch)
- Footage reveals Nvidia’s secret robot breakthrough (ad)
Disclaimer: This analysis is for educational purposes only and should not be considered investment advice. Always do your own research before making investment decisions.
Items marked with an asterisk (*) are promotional and help support this newsletter at no cost to readers.