What Apple and Amazon Had in Common
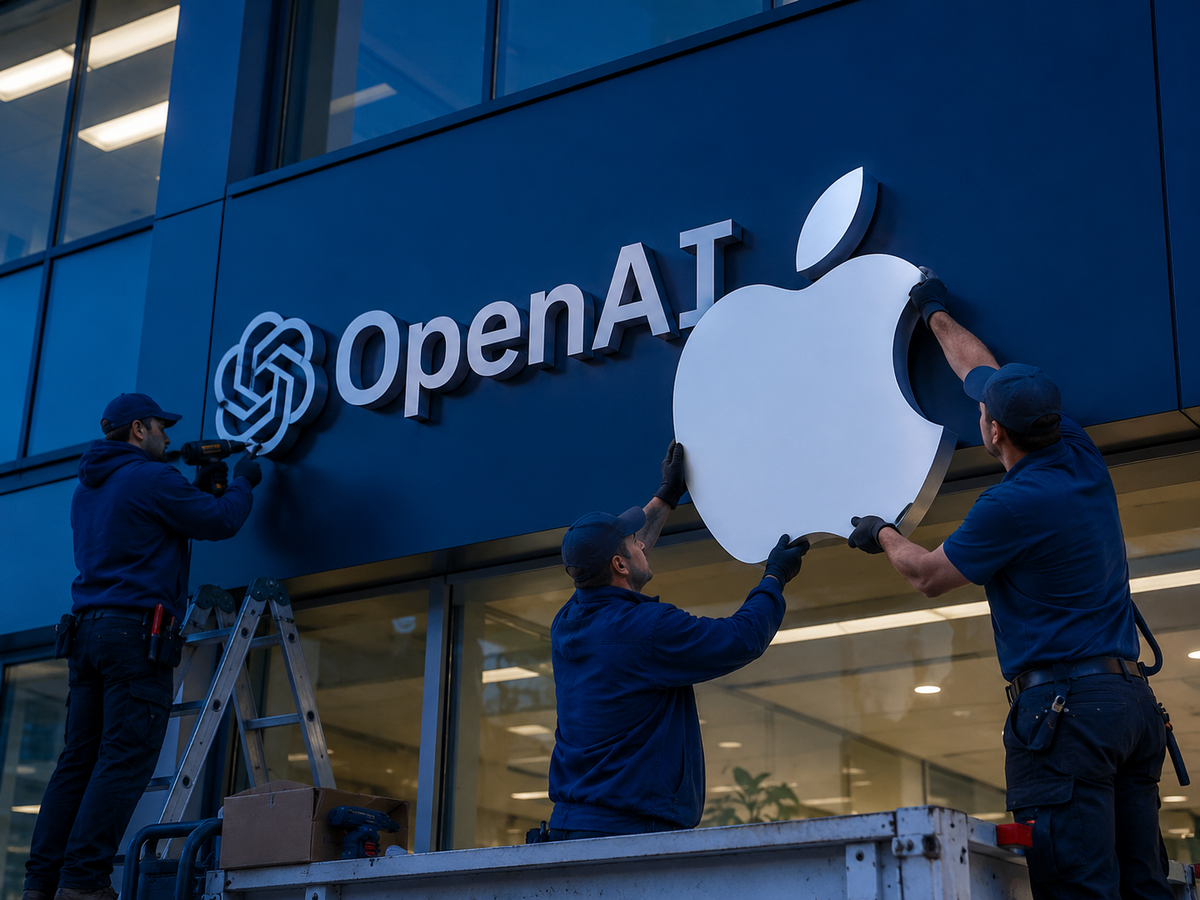
The Pattern Smart Investors Watch...
— In partnership with Mode Mobile —
Every major tech platform started the same way.
With simple behavior.
Apple — people using personal computers.
Amazon — people buying things online.
Facebook — people connecting online.
Small behavior.
Massive scale.
Now look at what people do today.
They spend hours on their phones.
Scrolling.
Watching.
Listening.
Every single day.
Mode Mobile is building around that behavior.
Already reporting:
- 490M+ users
- 59,000+ investors
- $115M in revenue and $11.8M as EBITDA
Mode Mobile’s EarnPhone technology is built to turn phones into earning devices.
And the company has discussed a Potential IPO. Some investors look for patterns like this early.
Learn more.

Please read the offering circular and related risks at invest.modemobile.com. This is a paid advertisement for Mode Mobile’s Regulation A+ Offering.
Mode Mobile recently received their ticker reservation with Nasdaq ($MODE), indicating an intent to IPO in the next 24 months. An intent to IPO is no guarantee that an actual IPO will occur.
The Deloitte rankings are based on submitted applications and public company database research, with winners selected based on their fiscal-year revenue growth percentage over a three-year period.
Pro forma revenue and EBITDA, includes full year numbers of the businesses acquired throughout 2025.
Hidden Debt in Mega-Cap Tech and the Defensive Capital Response
The press spent this week asking if AI will justify the largest corporate buildout in history. That is the wrong question. The right one: **who is paying for it, and where is the debt hiding.**
Nikkei Asia found a number that should halt every portfolio review: $1.65 trillion in off-balance-sheet debts across five firms — Alphabet, Microsoft, Amazon, Meta, and Oracle. Add the roughly $1.35 trillion they report as formal debt. Total debts near **$3 trillion**.
More than half sits outside the balance sheet.
These are not guesses. Meta's hidden debts alone reach $420 billion — nearly triple its stated debt. I checked Meta's latest 10-Q. It confirms the figure almost to the dollar: $182.9 billion in leases not yet started plus $237.7 billion in locked-in contracts.
The method is simple. Current rules let data center leases and GPU contracts stay in footnotes while sites are being built or chips are not yet shipped. The moment those data centers turn on, the debts move onto the balance sheet. This is not fraud. It is a timing gap built into GAAP itself.
Amazon's filings are hard to read. They lump leases, purchase deals, and known debt into one $569.3 billion total. That makes it nearly impossible to split out the hidden portion. Yet this same firm just ran two of the year's largest bond sales.
The debt is real. The shift onto balance sheets is coming. The question: does AI revenue arrive fast enough to cover it.
The Tactical Event Blueprint
What the media claims: Big Tech is boldly investing in AI. This shows vision.
What is actually happening at the capital layer: Five firms are stacking binding, must-pay debts at a rate that grew eightfold in about four years. Amazon raised C$14 billion (~$10 billion) in the largest Canadian bond sale ever. Then it came back to U.S. markets for at least $25 billion more — eight tranches run by Barclays, Goldman Sachs, J.P. Morgan, and Morgan Stanley. Bloomberg analysts noted this pace "suggests its AI spend is on a path in 2027 well above the $200 billion planned for 2026."
Amazon's trailing free cash flow fell 95% to $1.2 billion. Single-quarter capex hit $44.2 billion. Net income was boosted by $16.8 billion in Anthropic gains — a paper item that hides the cash reality.
This is not a growth story. This is a leveraged bet funded by bond markets, with free cash flow near zero.
How to protect or position your assets: Split the capital-light names from the heavy borrowers. The gap is not a matter of style. It is math.
The Corporate Weaponization: Apple as the Capital-Light Exception
While Amazon piles on debt, Apple sits at the other end of the spectrum.
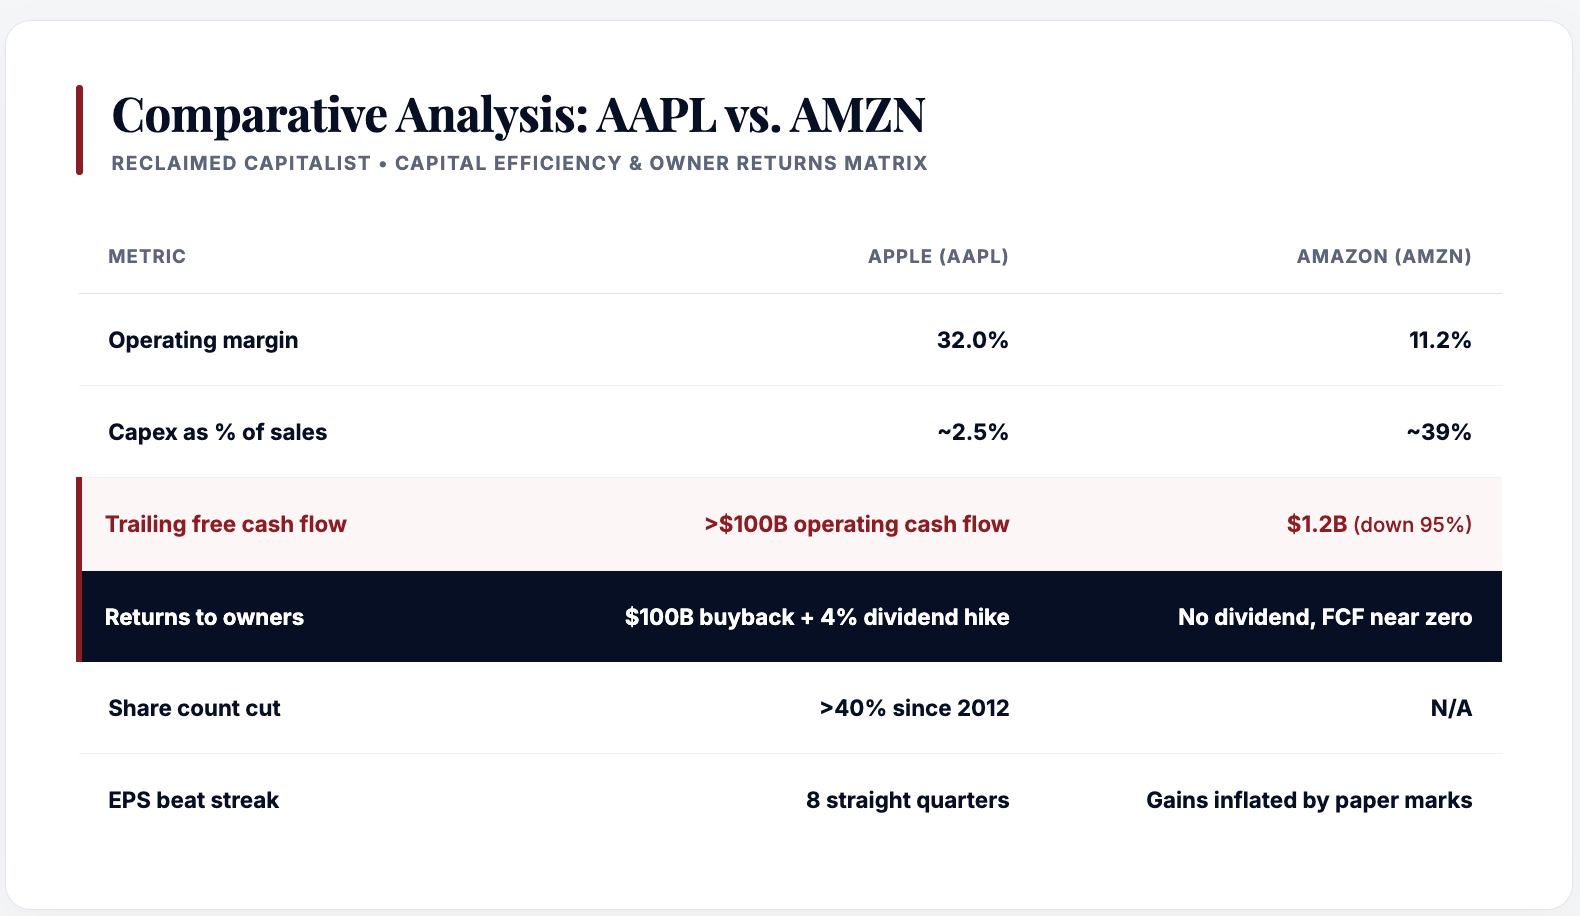
Apple's March quarter brought in $111.18 billion in revenue. Services hit a record $30.98 billion, driven by 2.5 billion active devices. This is high-margin, repeat revenue — the kind that funds dividends and buybacks without borrowing.
Apple's AI plan is lean on purpose: about 2.5% of sales goes to capex versus the ~39% pace at the big cloud builders. This keeps free cash flow intact at a deep level.
Apple's dividend, just raised to $0.27 per share each quarter ($1.08 per year, ~0.36% yield), is not a big income number. But it rests on one of the strongest cash engines in global markets. The five-year dividend growth rate is near 4.7%. The share count drop of over 40% since 2012 lifts per-share value in every decent quarter.
Apple is also shifting its supply chain to India — aiming for about 60 million iPhones per year and plans to build nearly all U.S.-bound units there by 2026. India's incentive programs, Foxconn's large new plants in Tamil Nadu, Karnataka, and Telangana, and the push toward "friendshoring" all cut Apple's reliance on any single country.
This is not a firm borrowing $35 billion in one month to fund risky builds. This is a firm making cash, giving it back to owners, and spreading its footprint — all at once.
For Individual Sovereigns checking portfolio mix, this gap matters. Administrative drag — the slow buildup of hidden debts, rising interest costs, and capex that eats free cash flow — is the quiet killer of value. It does not show up in earnings headlines. It shows up in footnotes, bond filings, and cash flow reports that most retail holders never read.
The Sovereign Directive: Deploying Covered Calls on Capital-Light Holdings
The method for pulling income from capital-light names is not complex. It is step-by-step.
Apple's current IV Rank sits at 100 — the top of its twelve-month range. This is a seller's edge. When implied volatility is high, option premiums grow. The cash you collect per contract rises in step.
With AAPL near $333.61 and the call wall at roughly $330.00 , the covered call setup follows a strict plan:
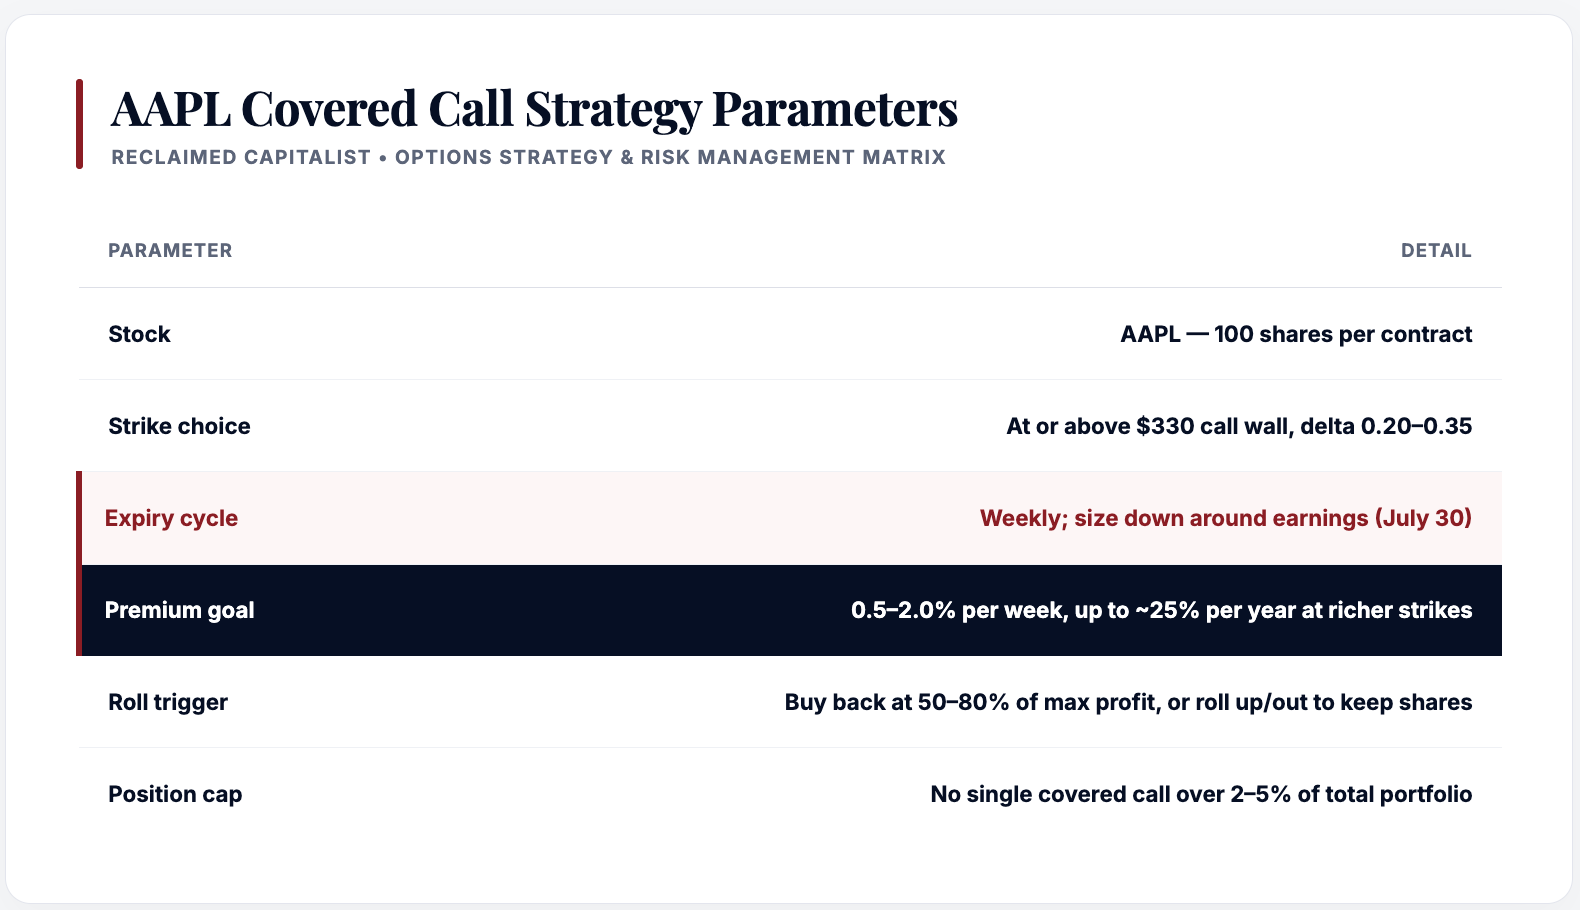
Earnings are about 11 days out. Premiums are rich, but a post-report gap can blow past your strike. The right move: cut size or wait for the print. This is not a tip. It is risk control.
A covered call does not guard against a big drop. It brings in near-term income, lowers your cost basis, and smooths returns on a stock you plan to hold. The trade-off — capped gains above the strike — is fine when the goal is Capital Reclamation through steady cash flow, not a lucky win.
Start small. Track premiums, how often shares get called away, and your adjusted cost basis with care. Compare net results to plain buy-and-hold each quarter.
The Sovereign Paycheck is not granted. It is engineered.
— Patrick Gibson The Reclaimed Capitalist
Most traders who struggle with options aren't bad at trading - they're just drowning in noise. New charts, tools, alerts, algorithms, and opinions crop up daily... and simply figuring out where to start can become overwhelming. Dave Aquino's 11-Hour Options for Beginners guide cuts through that noise with a clear plan and shows you real results. Inside, you'll get the A-Z breakdown of his 11-hour options income strategy in plain English, complete with the "battle-tested" ticker he's used nearly 900 times with a 95.3% success rate. And today, it's yours - FREE.
In partnership with Behind the Markets
Trump goes "all-in" on Grand Canyon energy breakthrough
Because last June, a drilling crew working right near the Grand Canyon…
Unearthed a well of clean energy producing almost 8 times the output of the largest oil well in Saudi Arabia…
Capable of powering civilization for two million years.
Right here on American soil.
Go here now for the Grand Canyon breakthrough ticker>>
Disclaimer: This analysis is for educational purposes only and should not be considered investment advice. Always do your own research before making investment decisions.
Items marked with an asterisk (*) are promotional and help support this newsletter at no cost to readers.